
Upon the change of questionnaire software provider at Rygcenter Syddanmark, there was a need to transfer a feature from the old software to the new, which allows the patient to record their experienced pain on a digital drawing. The purpose of the drawing is twofold:
It needs to be possible for it to be displayed to the medical personnel who’s going to see the patient – and it needs to be possible to carry out anonymized research via its data.
While SurveyXact doesn’t natively have a drawing function as one of the tools you can use, it is however possible to create that functionality yourself.
Challenges:
- SurveyXact is only able to pass along questionnaire values through HTML input
- It isn’t possible to recreate the patient’s drawing by taking a screenshot
Project structure:
- Pre-defined digital drawing with known dimensions – here 500x450 pixels
- The patient’s digital drawing is getting reproduced as coordinates
- The coordinates can be passed through an HTML input in SurveyXact
- The coordinates are avaiable via the API
- The coordinates are passed through a custom function which transforms them into readable coordinates
- The legible coordinates are used to restore the image for the medical personnel
Dependencies:
P5.js. – https://p5js.org
Used through their CDN. The first attempt with vanilla javascript resulted in a delay of the drawn line on the drawing. This was normalized by using this library and its built-in functions.
Code - full sample in the bottom:
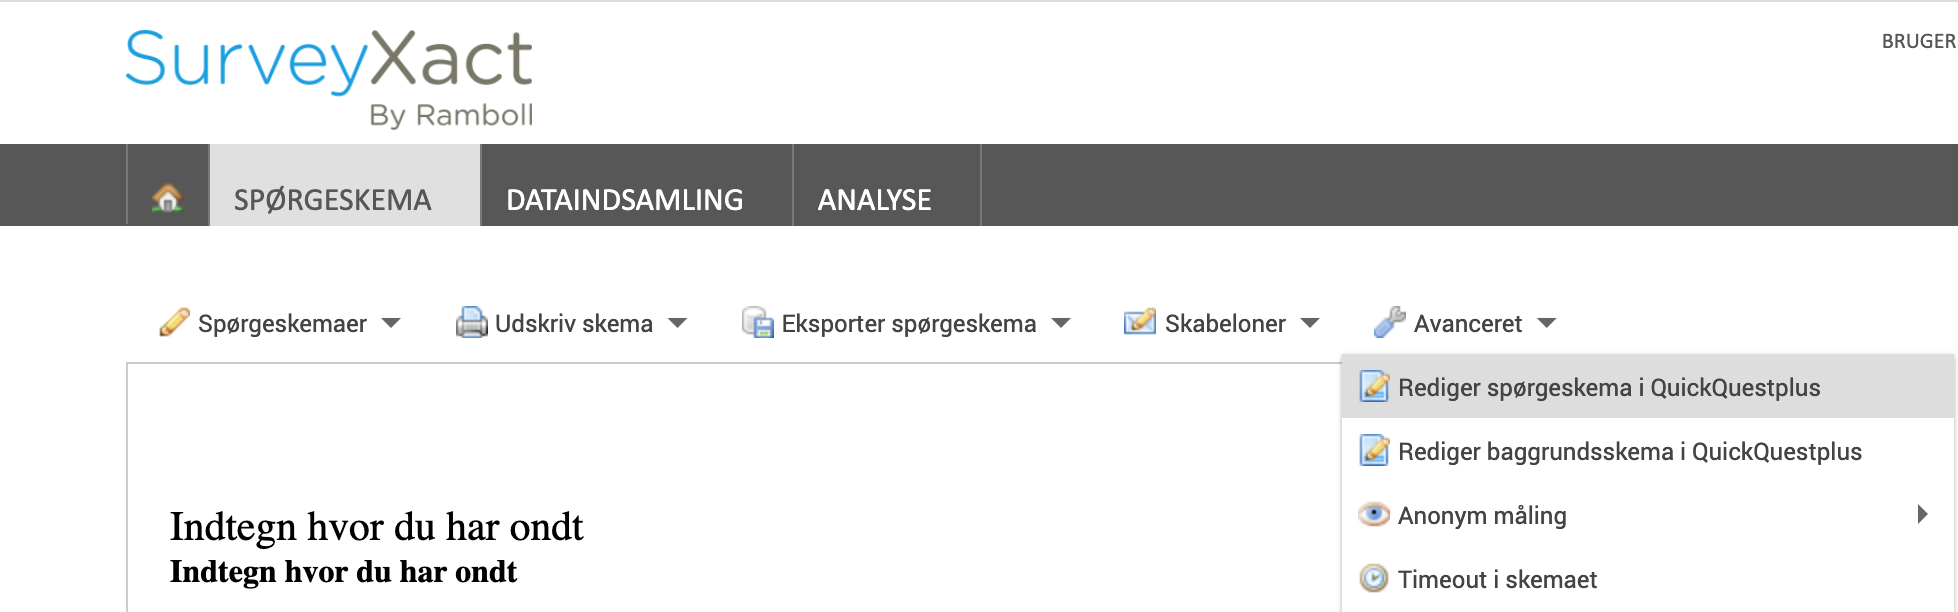
To implement the code, edit in QuickQuestplus.
Insert the code into the text box and be sure to start and end with “” – as well as make sure that there aren’t two whitespaces in succession.
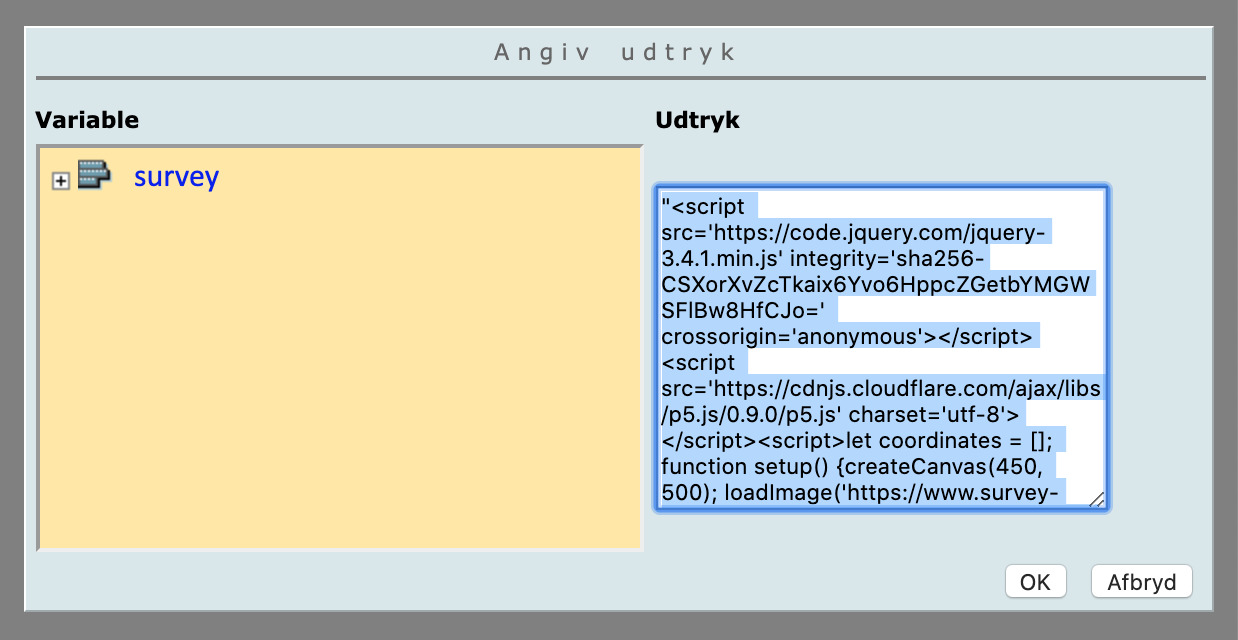
The loadImage() parameter is here filled in with the url for the image uploaded in SurveyXact.

Now add an input field – you will need the ID off this field. To find the ID, enter the menu called "Advanced/Avanceret"
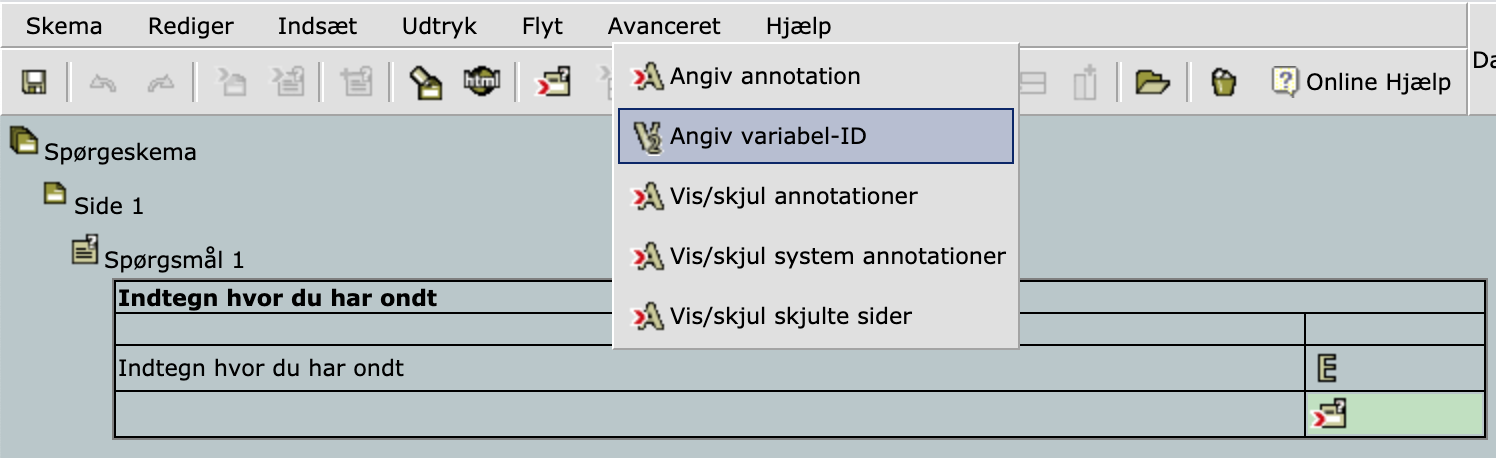
You need the ID to give the value of your array to the HTML element input, which is then passed on in SurveyXact.

You should now be able to draw on the image you provided. The code is posted down below and are free to use in your project.
// Include the p5.js library
<script src="https://cdnjs.cloudflare.com/ajax/libs/p5.js/0.9.0/p5.js" charset="utf-8"></script>

// Coordinate array to store the values in
let coordinates = [];

// Create the canvas on page load
function setup() {
 createCanvas(700, 568);

 // Assigning it to the div with id: #canvas
 canvas.parent('canvas');

 background(204);
 redraw();

 // Loads the image and place it at the top-left corner
 let bg = loadImage('path/to/your/image', img => {
  image(img, 0, 0);
 });
}

// Places a point on the canvas on click
function draw() {
 // Stroke color
 stroke(255, 40, 0);

 // Check if mouse is pressed
 if (mouseIsPressed === true) {
  point(mouseX, mouseY);
 }
}

// Places points on the canvas on drag
function mouseDragged() {
 // Appends the coordinates to the array
 coordinates.push(mouseX + ',' + mouseY);
 // Prevents strokes between points
 noStroke();
 fill(255, 40, 0);
 strokeWeight(3);
 point(mouseX, mouseY);
}
Follow along in part 2 where we recreate the respondents drawing.